Clear, 59° F
University of Wyoming professors, with assistance from a UW graduate student from Basin, developed a public health tool to track COVID-19 data — one that provides up-to-date information …
This item is available in full to subscribers.
The Powell Tribune has expanded its online content. To continue reading, you will need to either log in to your subscriber account, or purchase a subscription.
If you are a current print subscriber, you can set up a free web account by clicking here.
If you already have a web account, but need to reset it, you can do so by clicking here.
If you would like to purchase a subscription click here.
Please log in to continue |
|
University of Wyoming professors, with assistance from a UW graduate student from Basin, developed a public health tool to track COVID-19 data — one that provides up-to-date information tailored for rural areas, such as Wyoming.
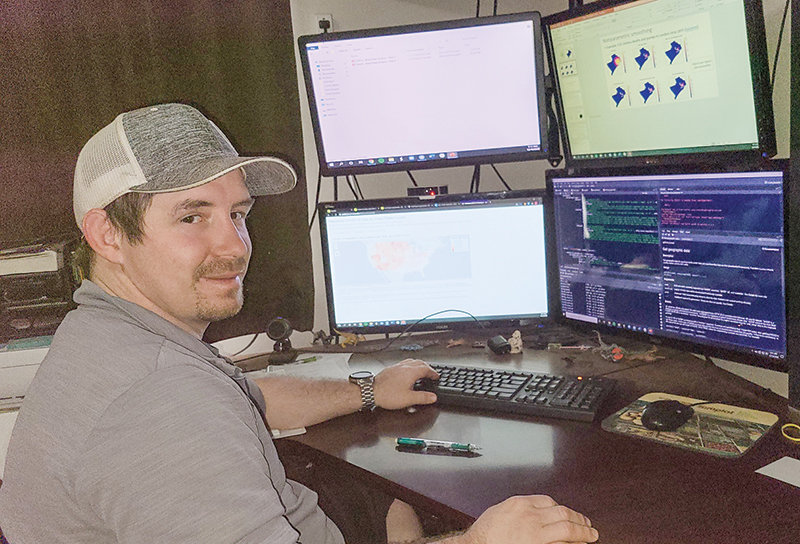
Pavel Chernyavskiy, in the UW Department of Mathematics and Statistics, and Tim Robinson, a statistics professor and the director of UW’s WWAMI (Washington, Wyoming, Alaska, Montana and Idaho) Medical Education Program, are the co-principal investigators of the project. Colton Zier, from Basin, assisted on the ongoing project.
The UW team recently produced the “Interactive COVID-19 Data by United States County” dashboard page. The dashboard establishes and maintains data visualization using maps related to SARS-CoV-2 and COVID-19. It’s online at https://pathfinder.arcc.uwyo.edu:3839/covidvisualmap/.
Zier, a 2008 Riverside High School graduate, received his undergraduate degree in statistics, with a minor in mathematics, in spring 2019 and he recently earned a master’s in statistics, all from UW.
As the COVID-19 pandemic continues to spread nationwide, Chernyavskiy and Zier collaborated with the Wyoming Department of Health on a tool that will help increase understanding of COVID-19 cases across the country, particularly in each Wyoming county. Earlier this fall, Chernyavskiy and Zier had preliminary discussions with Noah Hull and his team at the Department of Health about the COVID-19 dashboard page.
“These collaborations will carry over beyond the current pandemic because all parties are interested in answering pressing public health questions,” Chernyavskiy says.
He adds that he is a believer in using science — more precisely, statistics — to do important things.
“I was happy that, this time, our training and research interests were useful in trying to understand this pandemic,” Chernyavskiy says. “In my field, we often work with data that have already been collected and, so, statistics is used to try to understand what happened in the past. It has been equal parts exciting and humbling to apply my training to live, real-time data, as this pandemic continues to unfold.”
The data for UW’s interactive webpage come from the Center for Systems Science and Engineering at Johns Hopkins University. Data are updated daily and used to compile reports from individual state and county public health offices. Chernyavskiy said the UW dashboard page is different.
“We focus on geographic disparities in incidence at a snapshot in time — using data from a day ago — rather than trends over time,” he said. “We also provide a statistically ‘smoothed’ map of COVID incidence that helps the reader see geographic patterns more clearly than by using raw data alone.”
He said this is important for rural areas, such as Wyoming and across the Mountain West, where counties tend to be sparsely populated, and incidence rates using raw data can be unrealistic.
UW’s dashboard is composed of three maps:
• The first, “Three Day Incidence Rate,” provides a snapshot of the current conditions to the number of new cases per 100,000 people.
• The second, “Trend Evaluation,” reflects whether the trend in new cases per day has improved, gotten worse or stayed about the same over the past week vs. the past month.
“The map can help inform public health officials whether local ordinances have had an impact on flattening the local curve,” Chernyavskiy says.
• The third map, “Predicted Incidence Rate,” provides a “smoothed” (statistically modeled) version of incidence rates, which helps more easily to view statewide, regional and nationwide geographic patterns of risk.
“Rates computed in rural counties can be unrealistic due to low populations, which results in small denominators for those rates,” Chernyavskiy says. “Our ‘smoothed’ map is designed to help mitigate this issue by borrowing information from neighboring counties to optimally smooth out risk by using a statistical model.”
Zier was involved in the data processing and model creation of the data when the project first launched.
“I also was responsible, with help, for creating the dashboard that can automatically update daily to show the plots that we have created,” he said. “My involvement today is helping to maintain and improve the dashboard in a manner that keeps it running daily and improving in areas that we can.”
Chernyavskiy mentored Zier for his undergraduate capstone project in statistics, as well as the dashboard project, which served as Zier’s master’s degree project.
“Colton [Zier] — like most successful graduate students — has a knack for getting into the nitty-gritty details, and I know he pulled more than a few all-nighters to get the website up and running,” Chernyavskiy said.
He added that Zier is also “very adept at building relationships,” which was essential for this project with multiple stakeholders.
“I have greatly enjoyed watching Colton grow in this role and see many open doors in his future,” Chernyavskiy said.
Zier said the project has been fun and challenging — and that he’s learned a lot about spatial data analysis and the current pandemic. He feels it’s been important to help understand and visualize the pandemic.
“There are holes in every dashboard that can be improved on,” he said, “and we wanted to find a way to contribute in ways that we have not yet seen.”


